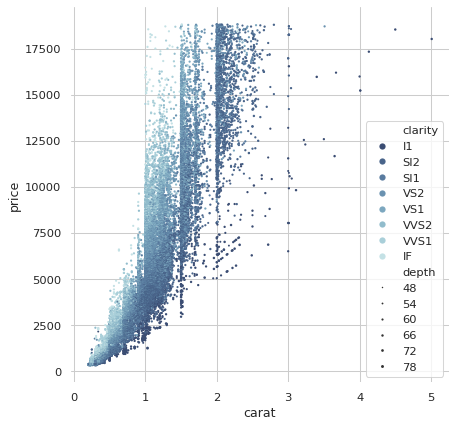
Scatterplot with multiple semantics#

seaborn components used: set_theme(), load_dataset(), despine(), scatterplot()
import seaborn as sns
import matplotlib.pyplot as plt
sns.set_theme(style="whitegrid")

# Load the example diamonds dataset
diamonds = sns.load_dataset("diamonds")

# Draw a scatter plot while assigning point colors and sizes to different
# variables in the dataset
f, ax = plt.subplots(figsize=(6.5, 6.5))
sns.despine(f, left=True, bottom=True)
clarity_ranking = ["I1", "SI2", "SI1", "VS2", "VS1", "VVS2", "VVS1", "IF"]
sns.scatterplot(x="carat", y="price",
                hue="clarity", size="depth",
                palette="ch:r=-.2,d=.3_r",
                hue_order=clarity_ranking,
                sizes=(1, 8), linewidth=0,
                data=diamonds, ax=ax)